2. Methods
2.1 Study Area
The study was conducted at a regional scale. Water samples were taken from 55 sites in Tomahawk Creek and Deep Creek, Alberta. Each sampling site is located at the discharge outlet of a delineated catchment area. The total study area is 321.12 km² and is relatively flat, with the maximum slope not exceeding 25°. In total, eight sampling campaigns were conducted, with four taking place in summer 2020 and four in summer 2021 after the May Tomahawk wildfire. Each campaign was completed within two to three days to ensure sampling consistency. Figure 1 displays the study area. Samples were analyzed in the UofA Natural Resources Analytical Laboratory and the quality of DOC was examined using the Ultraviolet–visible spectroscopy and Aqualog fluorometer.
Figure 1. Map showing the study area in green, sample sites in blue, and the boundary of the 2021 Tomahawk wildfire in red. Three sites are directly affected by the fire, and many sites are affected in the downstreams.

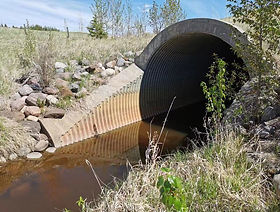
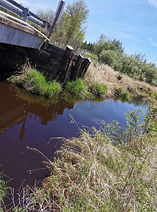

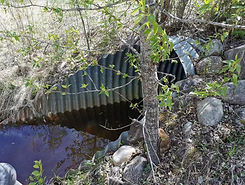
Pictures of discharge outlets of catchments. Samples are taken at or beside culverts.
2.2. Statistical Analysis
Data analysis was performed using R 4.1 and Python 3.9. I approached my first two objectives by multi-factor ANOVA and I established a factorial design including the effects of year (2020 and 2021) and fire (fire-disturbed and fire-undisturbed). This study could be viewed as containing these two treatments, and using multi-factor ANOVA allowed me to increase statistical power and tease out unwanted effects.
To explore the importance of wildfire as a driver, I performed a random forest model. A random forest model employs a group of decision-making trees. I used random forest regression to predict the importance of each response variables in terms of DOC change, and having a group of decision trees helps increase the accuracy of modeling and reduces overfitting. Data was split into training and testing set. I accepted the default value for mtry and I selected the ntree value that generated the smallest error. I plotted the feature importance chart using %IncMSE. After testing the model, I included the fitness of the model by plotting the predicted versus the actual values. Given the complexity of environmental variables, I also inquired the variance components on the leading factors that were ranked by the random forests.